Integrating Observability in Splunk with .NET and Splunk Collector
2025-09-20Splunk is a platform for searching, monitoring, and analyzing logs, metrics, and traces.
You can set up a local .NET integration with Splunk to test and validate your observability setup and ensure the integration works before moving on to a production setup. The easiest way is to use Docker and a docker-compose file that includes the Splunk application, the Splunk OTEL collector, and a .NET application that generates OpenTelemetry metrics.
.NET Application
To generate metrics, you need an instrumented application. In this example, we use .NET, but the steps apply to any framework that supports OpenTelemetry. We will use OpenTelemetry libraries to instrument the application without using any Splunk-specific libraries. Once the OpenTelemetry libraries are set up, you can connect them to output signals to the Splunk OTEL collector, which will forward the data to the Splunk platform.
Create minimal-otel-app/Program.cs with the following content:
using OpenTelemetry;
using OpenTelemetry.Metrics;
using OpenTelemetry.Resources;
using OpenTelemetry.Trace;
using Serilog;

var builder = WebApplication.CreateBuilder(args);

var serviceName = "MinimalAspNetApp";
var tracingOtlpEndpoint = "http://splunk-collector:4317";

Log.Logger = new LoggerConfiguration()
    .WriteTo.Console()
    .WriteTo.OpenTelemetry(
        endpoint: tracingOtlpEndpoint,
        protocol: Serilog.Sinks.OpenTelemetry.OtlpProtocol.Grpc)
    .CreateLogger();

Serilog.Debugging.SelfLog.Enable(msg => Console.Error.WriteLine(msg));

builder.Host.UseSerilog();

builder.Services.AddOpenTelemetry()
    .ConfigureResource(r => r.AddService(serviceName))
    .WithMetrics(metrics =>
    {
        metrics.AddAspNetCoreInstrumentation();
        metrics.AddRuntimeInstrumentation();
        metrics.AddOtlpExporter(options =>
        {
            options.Endpoint = new Uri(tracingOtlpEndpoint);
            options.Protocol = OpenTelemetry.Exporter.OtlpExportProtocol.Grpc;
        });
    })
    .WithTracing(tracing =>
    {
        tracing.AddAspNetCoreInstrumentation();
        tracing.AddHttpClientInstrumentation();
        tracing.AddOtlpExporter(options =>
        {
            options.Endpoint = new Uri(tracingOtlpEndpoint);
            options.Protocol = OpenTelemetry.Exporter.OtlpExportProtocol.Grpc;
        });
    });

var app = builder.Build();

app.MapGet("/", () =>
{
    Log.Information("Hello OpenTelemetry!");
    return "Hello OpenTelemetry!";
});

var cancellationTokenSource = new CancellationTokenSource();
var token = cancellationTokenSource.Token;

_ = Task.Run(async () =>
{
    while (!token.IsCancellationRequested)
    {
        Log.Information("Background log at {Time}", DateTimeOffset.Now);
        await Task.Delay(TimeSpan.FromSeconds(5), token);
    }
}, token);

app.Lifetime.ApplicationStopping.Register(() =>
{
    cancellationTokenSource.Cancel();
    Log.Information("Application stopping");
    Log.CloseAndFlush();
});

app.Run();
minimal-otel-app/.csproj:
<Project Sdk="Microsoft.NET.Sdk.Web">

  <PropertyGroup>
    <TargetFramework>net9.0</TargetFramework>
    <ImplicitUsings>enable</ImplicitUsings>
    <Nullable>enable</Nullable>
    <OutputType>Exe</OutputType>
  </PropertyGroup>

  <ItemGroup>
    <PackageReference Include="OpenTelemetry" Version="1.8.0" />
    <PackageReference Include="OpenTelemetry.Exporter.OpenTelemetryProtocol" Version="1.8.0" />
    <PackageReference Include="OpenTelemetry.Extensions.Hosting" Version="1.8.0" />
    <PackageReference Include="OpenTelemetry.Instrumentation.AspNetCore" Version="1.8.0" />
    <PackageReference Include="OpenTelemetry.Instrumentation.Http" Version="1.8.0" />
    <PackageReference Include="OpenTelemetry.Instrumentation.Runtime" Version="1.8.0" />

    <PackageReference Include="Serilog" Version="3.1.1" />
    <PackageReference Include="Serilog.Sinks.OpenTelemetry" Version="1.2.0" />
    <PackageReference Include="Serilog.AspNetCore" Version="7.0.0" />
  </ItemGroup>

</Project>
You will also need a Dockerfile so the application be be used in Docker:
# Build stage
FROM mcr.microsoft.com/dotnet/sdk:9.0 AS build
WORKDIR /app
COPY *.csproj ./
RUN dotnet restore
COPY . ./
RUN dotnet publish -c Release -o /out
# Runtime stage
FROM mcr.microsoft.com/dotnet/aspnet:9.0
WORKDIR /app
COPY /out .
EXPOSE 80
ENTRYPOINT ["dotnet", "MinimalAspNetApp.dll"]Splunk OTEL Collector
Splunk OpenTelemetry Collector acts as a forwarder to the Splunk platform. It can accept OTEL output natively and send data directly to Splunk with the splunk_hec exporter.
The collector uses a configuration file called relay.yaml, which we need to modify for the local setup. This file contains tokens and URLs for the collector to use. We will add variables that will be filled in by the final docker-compose file.
receivers:
  otlp:
    protocols:
      grpc:
        endpoint: 0.0.0.0:4317
      http:
        endpoint: 0.0.0.0:4318

processors:
  batch:
  resource/add_environment:
    attributes:
    - action: insert
      key: deployment.environment
      value: environment
  resource/add_version_tag:
    attributes:
    - action: insert
      key: semantic.version
      value: v1.1.0

exporters:
  splunk_hec:
    token: ${SPLUNK_OBSERVABILITY_ACCESS_TOKEN}
    endpoint: http://splunk:8088
    source: otel
    sourcetype: otel
    index: main
    tls:
      insecure_skip_verify: true
  debug:
    verbosity: detailed
  file/traces:
    path: /log/otel/traces.log
  file/metrics:
    path: /log/otel/metrics.log
  file/logs:
    path: /log/otel/logs.log

service:
  extensions: []
  pipelines:
    traces:
      receivers: [otlp]
      processors: [batch, resource/add_environment]
      exporters: [splunk_hec, debug, file/traces]
    metrics:
      receivers: [otlp]
      processors: [batch]
      exporters: [splunk_hec, debug, file/metrics]
    logs:
      receivers: [otlp]
      processors: [batch]
      exporters: [splunk_hec, debug, file/logs]
Your directory structure should now look like this:
minimal-otel-app/Dockerfile
minimal-otel-app/Program.cs
minimal-otel-app/MinimalAspNetApp.csproj
relay.yaml
Docker Compose Setup
We will now create a docker-compose YAML file that launches everything needed to test the full solution. It consists of a common network, the .NET application, Splunk, and the Splunk collector. It also contains variables for the Splunk token, which you will need to create the first time you run Splunk and replace later.
networks:
  myCommonNetwork:
    driver: bridge
    attachable: true

services:
  minimal-otel-app:
    networks:
      myCommonNetwork:
        aliases:
          - minimal-otel-app
    image: minimal-otel-app
    volumes:
    - ./log/minimal-otel-app:/log/minimal-otel-app
    build:
      context: ./minimal-otel-app
      dockerfile: Dockerfile
    environment:
      OTEL_EXPORTER_OTLP_ENDPOINT: "http://splunk-collector:4317"
      OTEL_SERVICE_NAME: "minimal-otel-app"
      OTEL_LOG_LEVEL: "debug"
      OTEL_DOTNET_AUTO_LOG_DIRECTORY: "/log/minimal-otel-app"
      OTEL_EXPORTER_OTLP_PROTOCOL: "Grpc"
    depends_on:
    - splunk-collector
    ports:
      - "32001:8080"

  splunk:
    networks:
      myCommonNetwork:
        aliases:
          - splunk
    image: splunk/splunk:latest
    restart: always
    ports:
      - "8000:8000"
      - "8088:8088"
    hostname: so1
    environment:
      SPLUNK_GENERAL_TERMS: "--accept-sgt-current-at-splunk-com"
      SPLUNK_START_ARGS: "--accept-license"
      SPLUNK_PASSWORD: "splunk12345"

  splunk-collector:
    networks:
      myCommonNetwork:
        aliases:
          - splunk-collector
    image: quay.io/signalfx/splunk-otel-collector:0.103.0
    restart: always
    ports:
      - "4318:4318" # OTLP HTTP
      - "4317:4317" # OTLP gRPC
      - "8888:8888" # Health check
      - "13133:13133" # Debug endpoint
    volumes:
    - ./log/collector:/log/otel
    - ./relay.yaml:/conf/relay.yaml
    command: ["otelcol","--config=/conf/relay.yaml"]
    environment:
      SPLUNK_MEMORY_TOTAL_MIB: "200"
      SPLUNK_OBSERVABILITY_ACCESS_TOKEN: "YOUR TOKEN GOES HERE"
    depends_on:
    - splunk
Launch with:
docker compose -f .\docker-compose.yaml upAfter a minute or so the Splunk application should be ready and you should be able to visit http://localhost:8000 and log in using the credentials:
- Username:
admin - Password:
splunk12345
Configuring Splunk to Receive Data
Now that we have Splunk up and running we need to configure it to be able to receive data from the OTEL collector. Follow these steps:
Create a Token
- Go to
Settings -> Data Input -> HTTP Event Collector - Select
New Token. - Create the token for
HTTP Event Collectorwith default settings. - Under
Input Settings, set the index tomain.
Once the token is created, stop docker-compose, add the token to the SPLUNK_OBSERVABILITY_ACCESS_TOKEN environment variable in docker-compose.yaml, and launch the docker-compose again.
Disable SSL for local testing
Next we need to disable SSL for local testing (do not do this in production):
- Go to
Settings -> Data Input -> HTTP Event Collector -> Global Settings -> Enable SSLand disable it.
Once this is done Splunk should be able to receive the logs forwarded by the Splunk Collector.
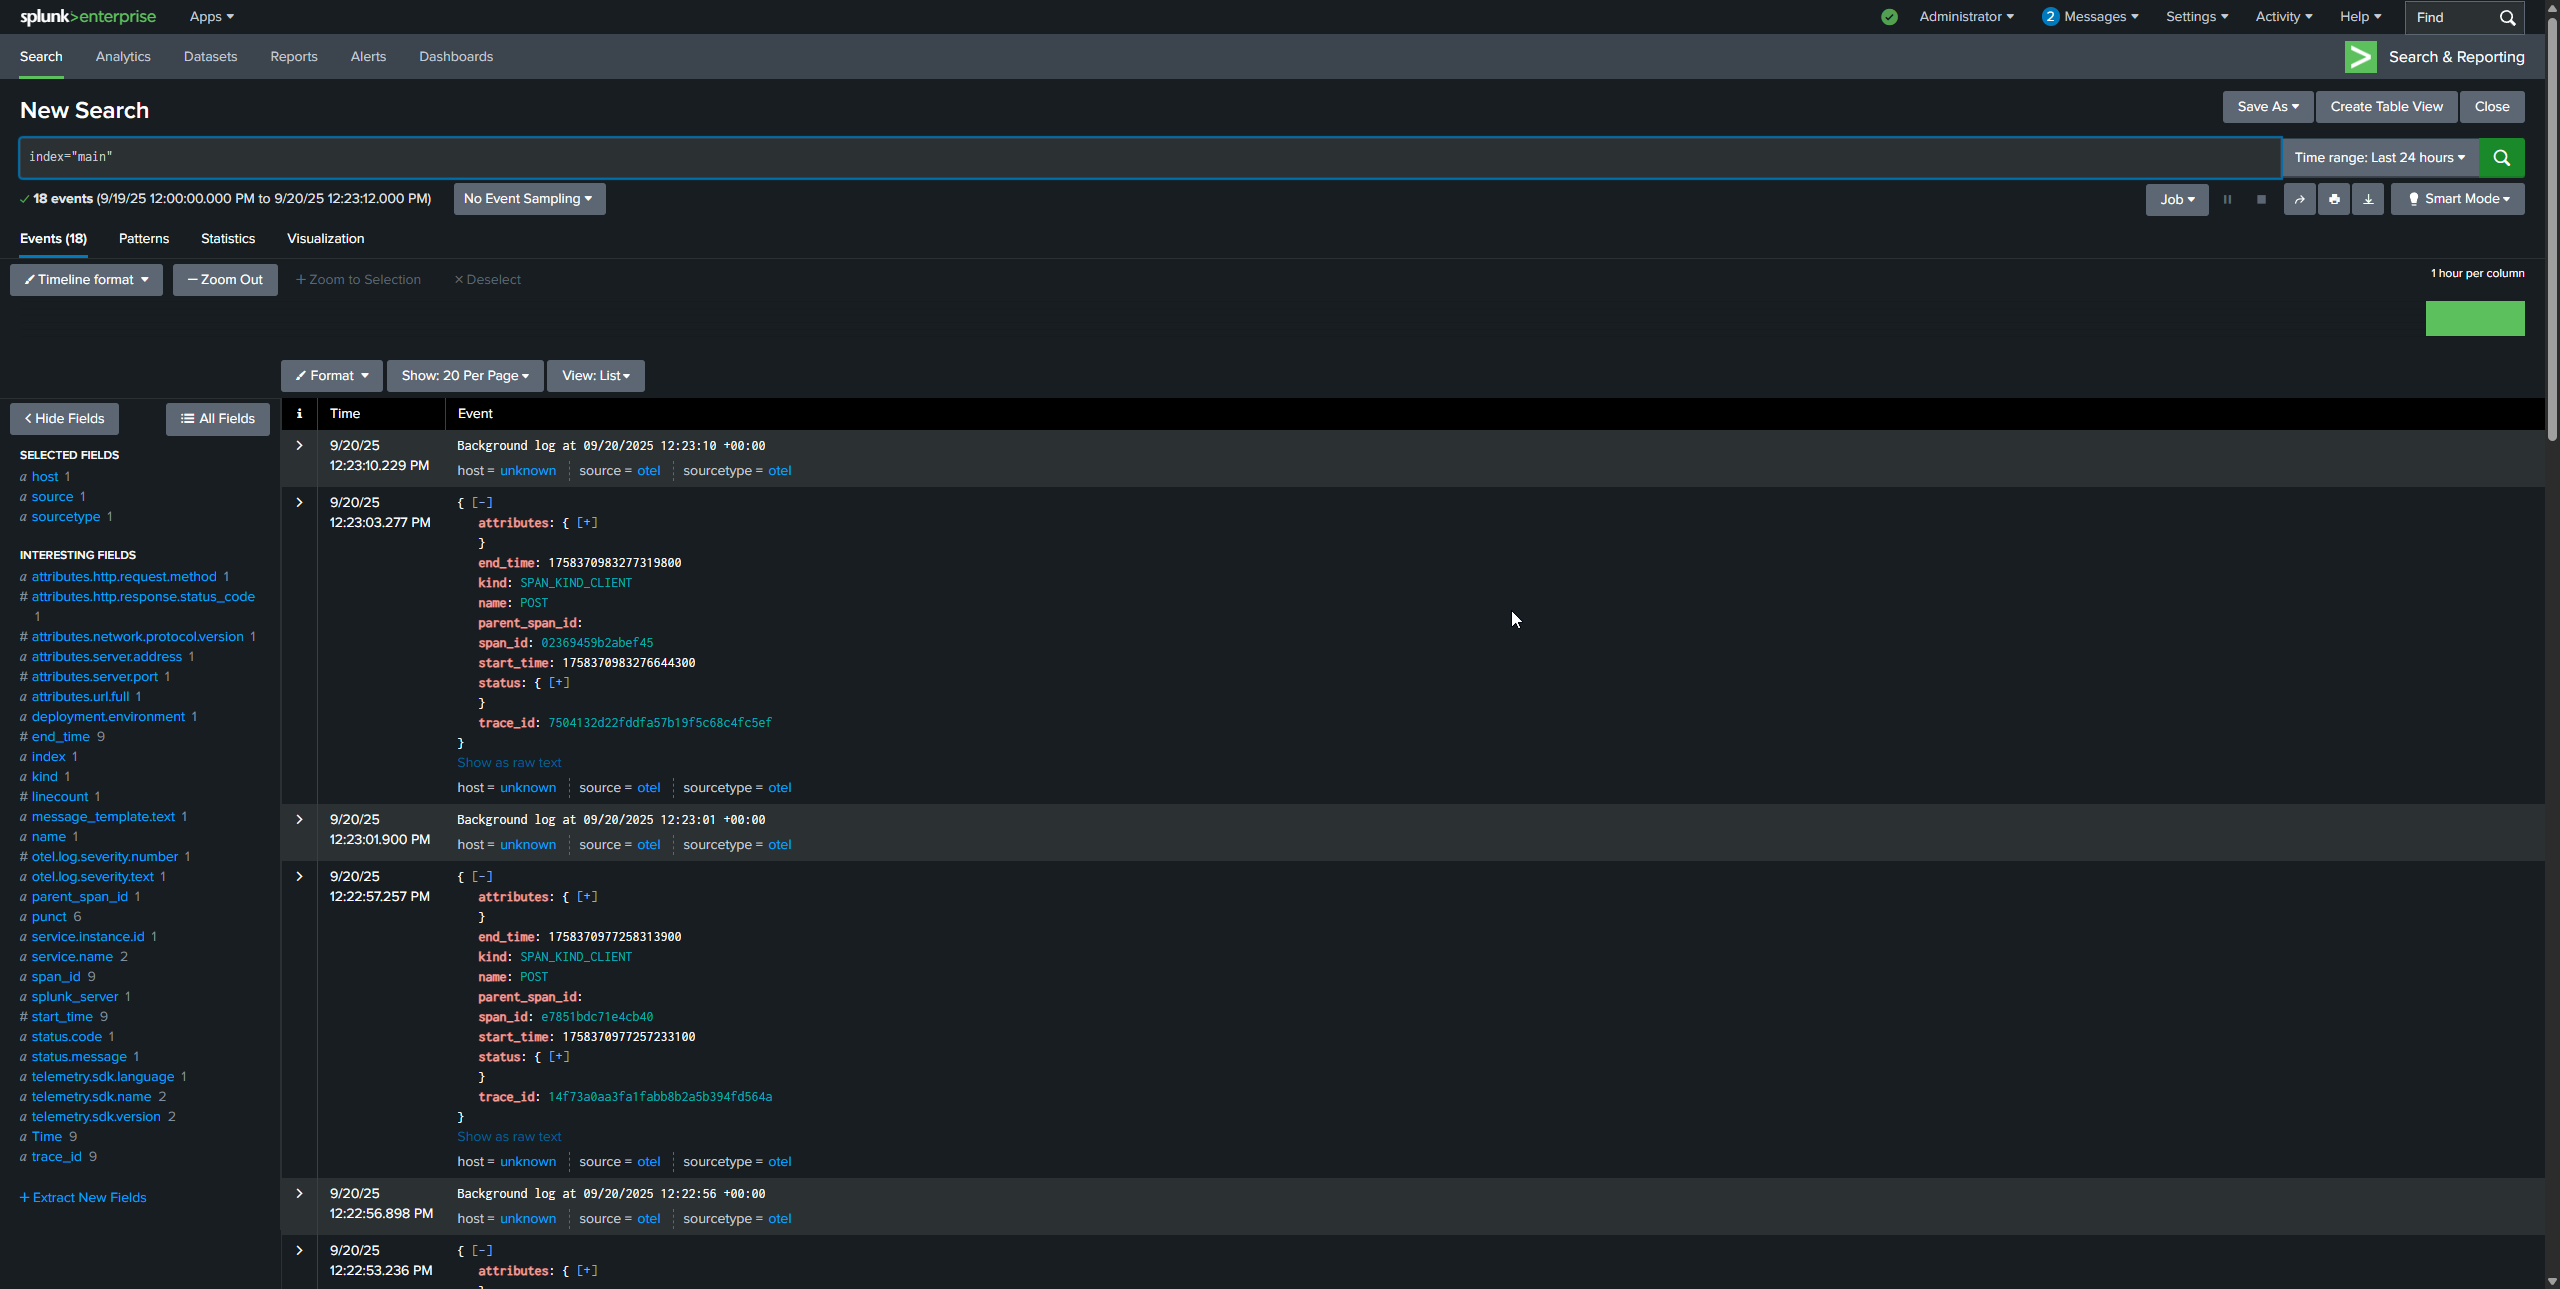
Verifying Data in Splunk
Navigate to the Search page and query:
index="main"You should see traces, metrics, and logs coming in from your application:
Summary
What we have created looks something like this:
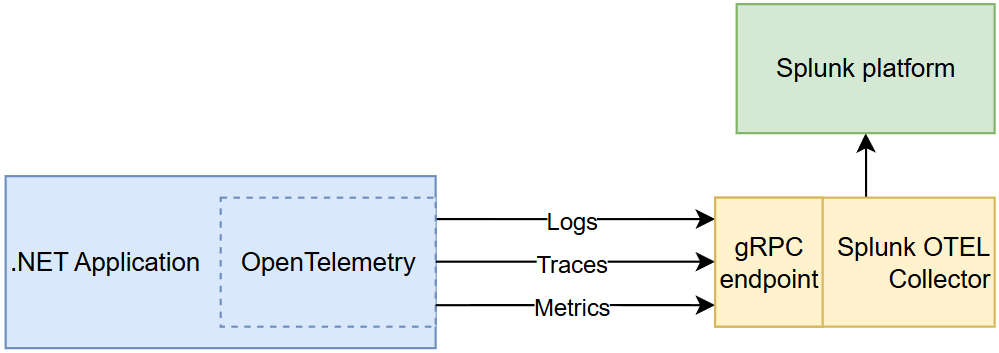
Once this is working, switching to a production instance is straightforward. A production instance will likely include additional Splunk Collectors acting as Gateways and may also be integrated with other infrastructure tools, such as fluentd to make it more scaleable:
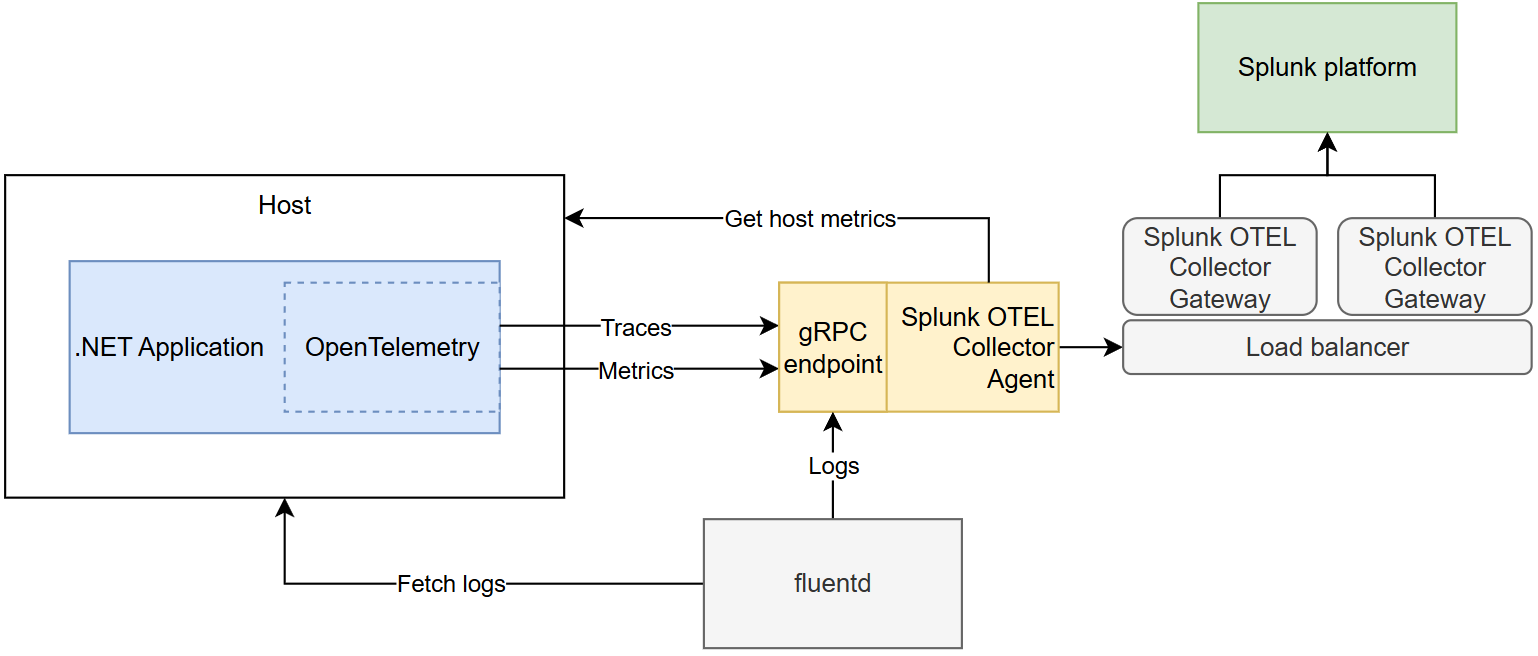
The full example code is available on GitHub.